Cross-border trade monitoring
Satellite proxies for trade at African border crossings for the World Bank, where trade data is sparse: a PlanetScope traffic index tracking relative traffic density, and YOLOv5 vehicle counts from high-resolution imagery.
Employer: Sparkgeo (client project)
When: 2023
Data: PlanetScope imagery, high-resolution RGB satellite imagery (50 cm to 1 m), xView training dataset
Methods: Custom traffic index from spatial and spectral convolutions, thresholding and size filtering, road and parking masks, deep learning object detection (YOLOv5), class aggregation
Stack: Python, PyTorch, Ultralytics, GeoPandas, Xarray, Rasterio, QGIS
Background
Developed countries collect detailed data on trade and logistics, but for many developing countries trade data is patchy or missing. The World Bank wanted to know whether satellite imagery could act as a proxy. It was interested in several measures, including cross-border traffic and the size of temporary markets along borders. The contract’s scope allowed one, so we focused on cross-border traffic, with the option to expand to other measures later. The study covered several border crossings in Africa, mainly Beitbridge, between South Africa and Zimbabwe.
Approach
We used two complementary approaches, because no single source of imagery offered both detail and frequency:
- Vehicle counts from high-resolution imagery (50 cm to 1 m) give a more direct and accurate estimate of traffic, but images are expensive and only sporadically available.
- A traffic index from PlanetScope (3 m) can’t resolve individual vehicles, but near-daily imagery can track relative changes in border activity over time.
The high-resolution counts also served as a check on the index on the dates when both were available.
How each worked:
- Traffic index (PlanetScope): several spatial and spectral convolutions highlighted vehicles on roads and parking lots around the crossing, and were combined into a single custom traffic index. Pixels above a threshold counted as detections; they were grouped into objects, and groups below a minimum size were removed. Detections were kept only within hand-delineated roads and parking lots, which removed false positives from unrelated features. The index for each image was the share of pixels within that mask that were detections, giving one relative traffic value per image.
- Vehicle detection (high-resolution imagery): an Ultralytics YOLOv5 model was trained on xView, a dataset of over 1 million labelled objects in 60 classes at 30 cm resolution. Only vehicle classes were kept, and they were merged into broader classes such as cars, passenger trucks and cargo trucks. The data was split 80/10/10 for training, validation and testing.
My contribution
- Traffic index: owned it end to end. I developed the logic and implemented it.
- Vehicle detection: helped the team plan the approach, designed how the xView classes were aggregated, and helped create a labelled test set from our study sites.
Outcome
- Traffic index vs known events: the index rose on or around the dates of many border disruptions reported on social media, though not all of them. A more quantitative check was planned at the Windsor–Detroit crossing, which has plentiful public traffic data to compare the index against, but it didn’t fit the project’s time and budget.
- Traffic index vs vehicle counts: the index tracked the high-resolution vehicle counts, rising and falling with them, which supports using it to fill the gaps between high-resolution images. The comparison was limited by the small amount of high-resolution imagery and by the satellites passing over at different times of day.
- Vehicle detection: the model reached a mAP50 (mean average precision, a standard detection score from 0 to 1) of about 0.6 on the xView test set but below 0.4 on the test set from our study sites. The gap wasn’t diagnosed within the project; likely factors include the resolution gap (30 cm training data against 50 cm to 1 m imagery), differences in image preprocessing such as contrast enhancement and normalization, and xView’s vehicle classes not matching the vehicles at these crossings.
- Planned improvements: other training datasets such as Cars Overhead With Context (COWC), labelling more of our own data at developing-world border crossings for training, not just testing, and stronger data augmentation. The project ended before these could be tried.
- Limitations: cloud cover (SAR was suggested as a way around it, but not explored); fixed overpass times; images are snapshots of traffic that changes continuously; and the cost of high-resolution imagery. We suggested other approaches, such as vehicle detection from roadside webcams, but the client specifically wanted to explore remote sensing.
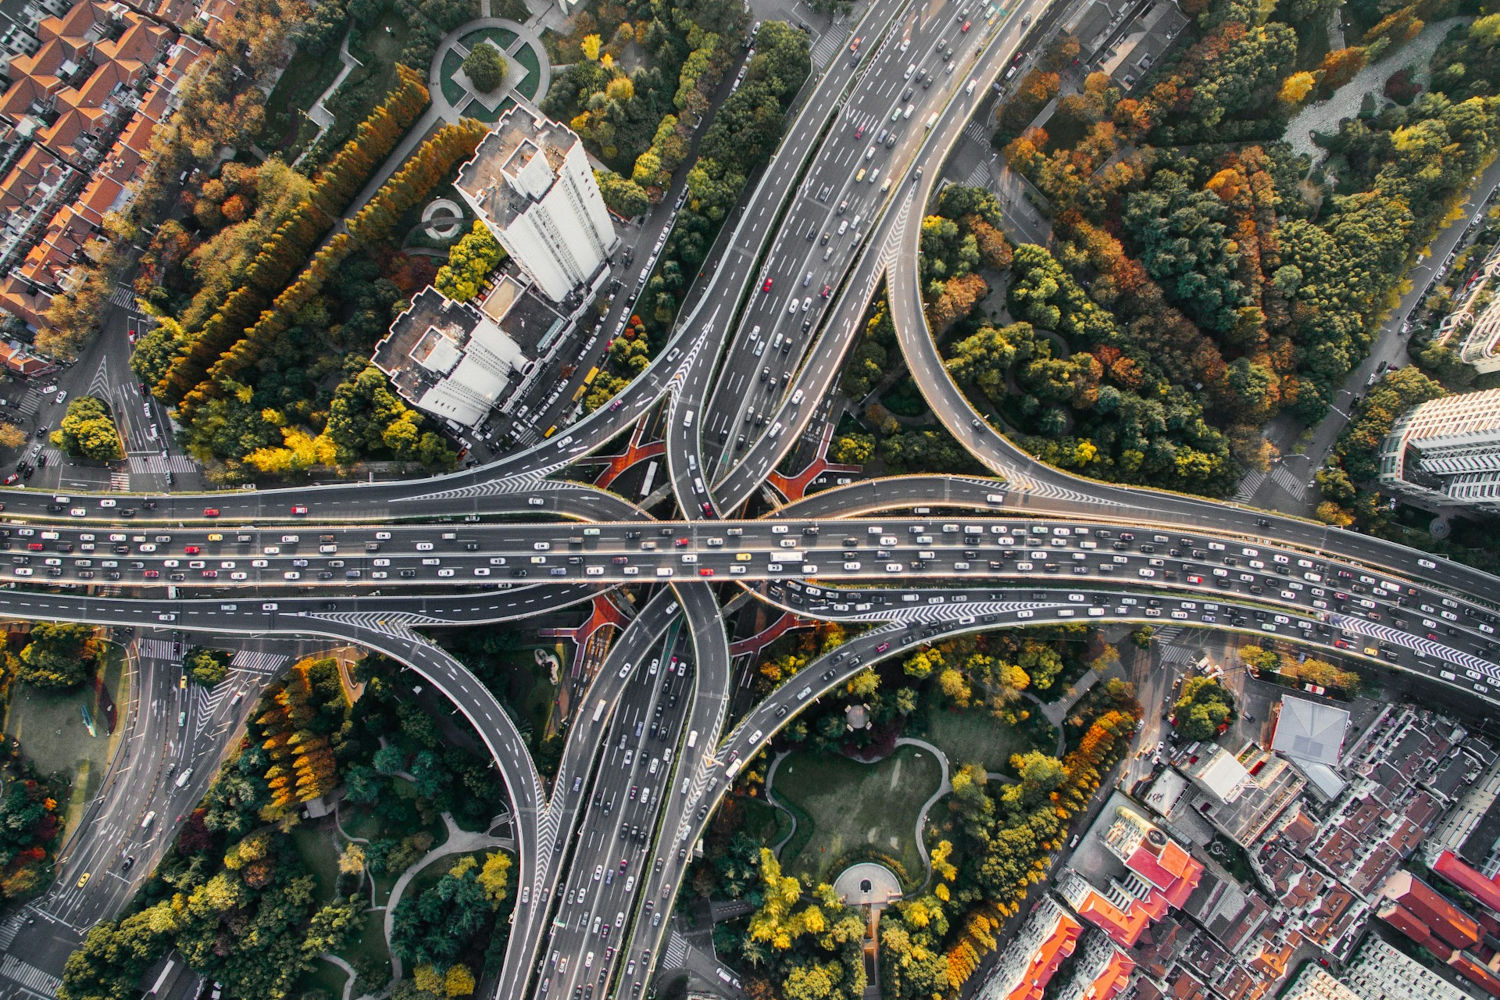
Cover image: Traffic on an interchange in Shanghai, China. Photo by Denys Nevozhai on Unsplash.