Agricultural practice metrics for carbon credits
A prototype field score for a carbon credit startup, rating each field’s crop rotation, tillage and cover cropping from crop maps, Sentinel-1 InSAR and Sentinel-2, run on AWS Batch across much of Saskatchewan.
Employer: Sparkgeo (client project)
When: 2024
Data: AAFC Annual Crop Inventory, Sentinel-1 SAR (Single Look Complex), Sentinel-2 multispectral imagery, field records from the client’s partner growers
Methods: InSAR coherence thresholding, Bare Soil Index (BSI) time series, crop rotation analysis, multi-tier and weighted scoring
Stack: Python, Xarray, Rasterio, ESA SNAP (esa_snappy), Docker, AWS (Batch, ECR, S3)
Background
Our client, a startup, wanted to provide carbon credit accounting for agricultural growers. Its concept was a “field score” quantifying how well a grower is adopting carbon-friendly practices. For the prototype, the score covered three practices: crop rotation, no-till or minimal tillage, and cover cropping.
Approach
Each practice was measured from a different data source, each suited to a different question about the same field: a national crop map supplied the history, radar showed surface disturbance regardless of cloud, and optical imagery showed soil cover.
- Crop rotation (AAFC Annual Crop Inventory): for each field, the last 7 years of crop type were grouped into broad classes, such as pulses and grains. The rotation score was based on how many times the class changed between consecutive years.
- Tillage (Sentinel-1 InSAR): Sentinel-1 Single Look Complex (SLC) data, which keep the phase information InSAR needs, were processed with ESA SNAP, driven from Python through esa_snappy. After standard SAR preprocessing, interferograms were formed through the time series between each image and the previous one from the same orbit and direction. When field-level coherence dropped below an empirically derived threshold, that was recorded as a tillage event. The tillage score was based on the number of events over several years.
- Cover cropping (Sentinel-2): the Bare Soil Index was calculated for each image after harvest and before seeding, and averaged over each field. To reduce the effect of clouds and other disturbances, a percentile of each year’s time series (such as the median) was taken. Multi-tier thresholds turned that into a yearly score, and the yearly scores were combined into an overall score.
- Field score: the three scores were combined into a weighted field score, with the weighting set in consultation with the client. Better rotations, fewer tillage events and less bare soil scored higher.
- Infrastructure: each workflow was containerized with Docker, pushed to Amazon ECR and run on AWS Batch.
My contribution
- Tillage: developed the entire InSAR workflow, from SAR preprocessing and interferogram generation to the coherence logic and thresholds, and implemented it on AWS Batch.
- Cover cropping: developed the Bare Soil Index logic. Colleagues handled its batch processing in the cloud.
- Crop rotation: provided input and supervision; colleagues implemented it.
- Field score: helped the team design the composite score. Colleagues built the harness that launched the separate workflows, brought the metrics together and computed the score.
Outcome
- The prototype ran over a large part of the Saskatchewan prairies. It was validated against records from a handful of the client’s partner growers: field tillage dates, crop rotations, and whether each field used cover crops.
- A wider run across the western Prairies (Alberta, Saskatchewan and Manitoba) was planned, but wasn’t completed during the contract.
- Tillage false positives: coherence also drops with other surface disturbances, such as seeding and harvest, and with crop growth between image pairs, so not every coherence drop is tillage. To reduce false positives, the tillage analysis was limited to early season, before crop growth would affect coherence.
- Limitations: the validation covered only a handful of growers, so wider validation would be needed. The scores also rely on thresholds set empirically and by reasoning. With more time, the next step would have been a machine learning approach, but there wasn’t enough training data for the prototype.
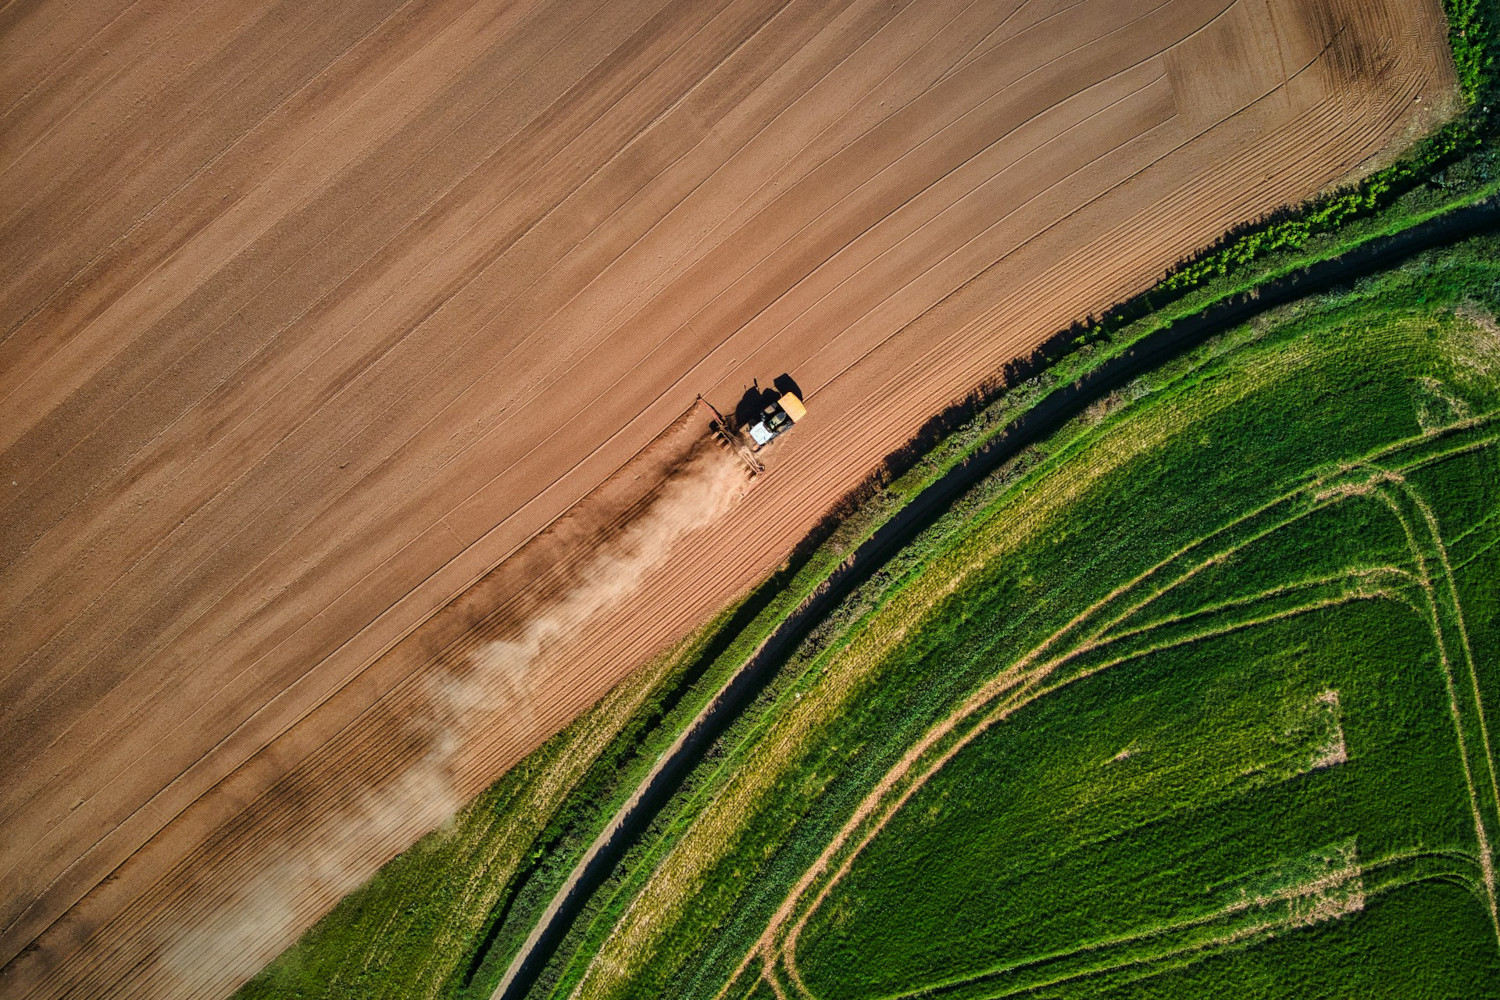
Cover image: A farmer prepares a field for seeding in Devon, UK. Photo by Red Zeppelin on Unsplash.