Crop health change alerting
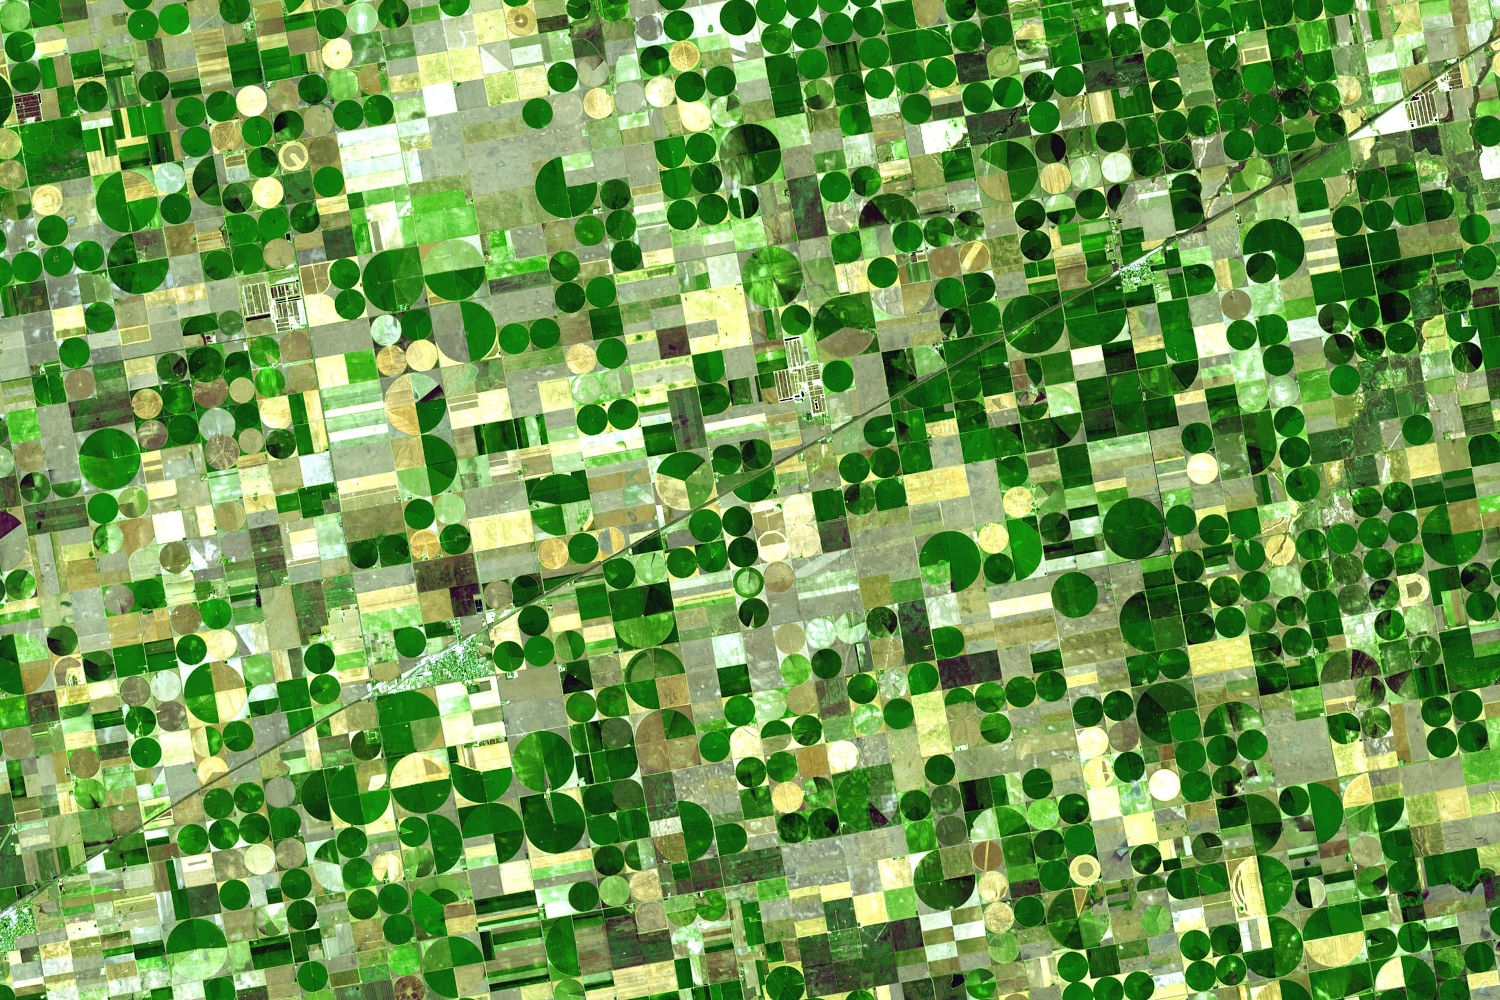
An automated system that watched fields in near-daily PlanetScope imagery and alerted growers to drops in crop health, running in production across millions of acres, with thresholds tuned against a field validation campaign.
Employer: Farmers Edge
When: 2018–2019
Data: PlanetScope imagery, field validation observations
Methods: NDVI relative normalization, time series change detection, threshold-based alerting, field validation
Stack: Python, GDAL, Rasterio, NumPy
Background
Growers can’t scout every field every day, but near-daily PlanetScope imagery can watch them for signs of trouble. Two things make simple change detection unreliable, though: calibration differences between the many PlanetScope satellites, and seasonal crop growth that looks like change. The aim was a system that flagged real drops in crop health and pointed growers to where they were happening.
Approach
- Relative normalization: each new image’s NDVI was normalized to the field’s average, which removed most of the calibration differences between satellites and the seasonal trend. Growers also saw these normalized layers in FarmCommand, the Farmers Edge platform, because they were more useful for scouting than absolute NDVI.
- Field-level alerts: normalized pixels were binned into classes from well below to above average, and the area in each class was tracked over time. An alert fired when the below-average area rose past a threshold within a rolling window of about two weeks. The change had to persist across consecutive images, so clouds didn’t trigger alerts.
- Change maps: after an alert, the current image was compared with the most representative image from the previous couple of weeks, and significant change was outlined as polygons over a continuous change layer.
- Delivery: growers got an email linking straight to the change layers in FarmCommand. New alerts that largely overlapped a recent alert on the same field were dropped, to avoid repeat emails.
My contribution
- Led the design and development of the alerting system.
- Designed a field validation protocol to validate and tune it. Field staff visited alert polygons and recorded whether there was an issue, with a 0–5 damage score and notes. They also sampled control points outside the alerts, so missed problems could be counted as well as false alerts.
- Trained field staff (agronomists and co-op students) in field observation collection protocols. Also trained and directed the Lethbridge-based remote sensing field team (about five people, including me) that collected most of the usable observations.
Outcome
- The system went into production in FarmCommand, running alerts across every field on the platform: millions of acres in Canada, the US, Brazil and Australia. Our software development team built the production version. I explained the workflow to them and validated its outputs against my prototype.
- Tuning the alert thresholds against the field observations made the system perform much better than with its original thresholds, especially at suppressing false alerts.
- Label quality depended on who collected it: observations from the team I directed were the most consistent, while those collected elsewhere in the Prairies by agronomists and summer students, alongside their other work, were patchier.
- Limitations:
- There was a validation set but no final held-out test set, so the performance estimates were likely optimistic.
- Hand tuned empirical thresholding may not be globally appropriate. Machine learning approaches were considered, but field observations were too sparse and inconsistent to use as labels.