Detecting home additions in aerial imagery
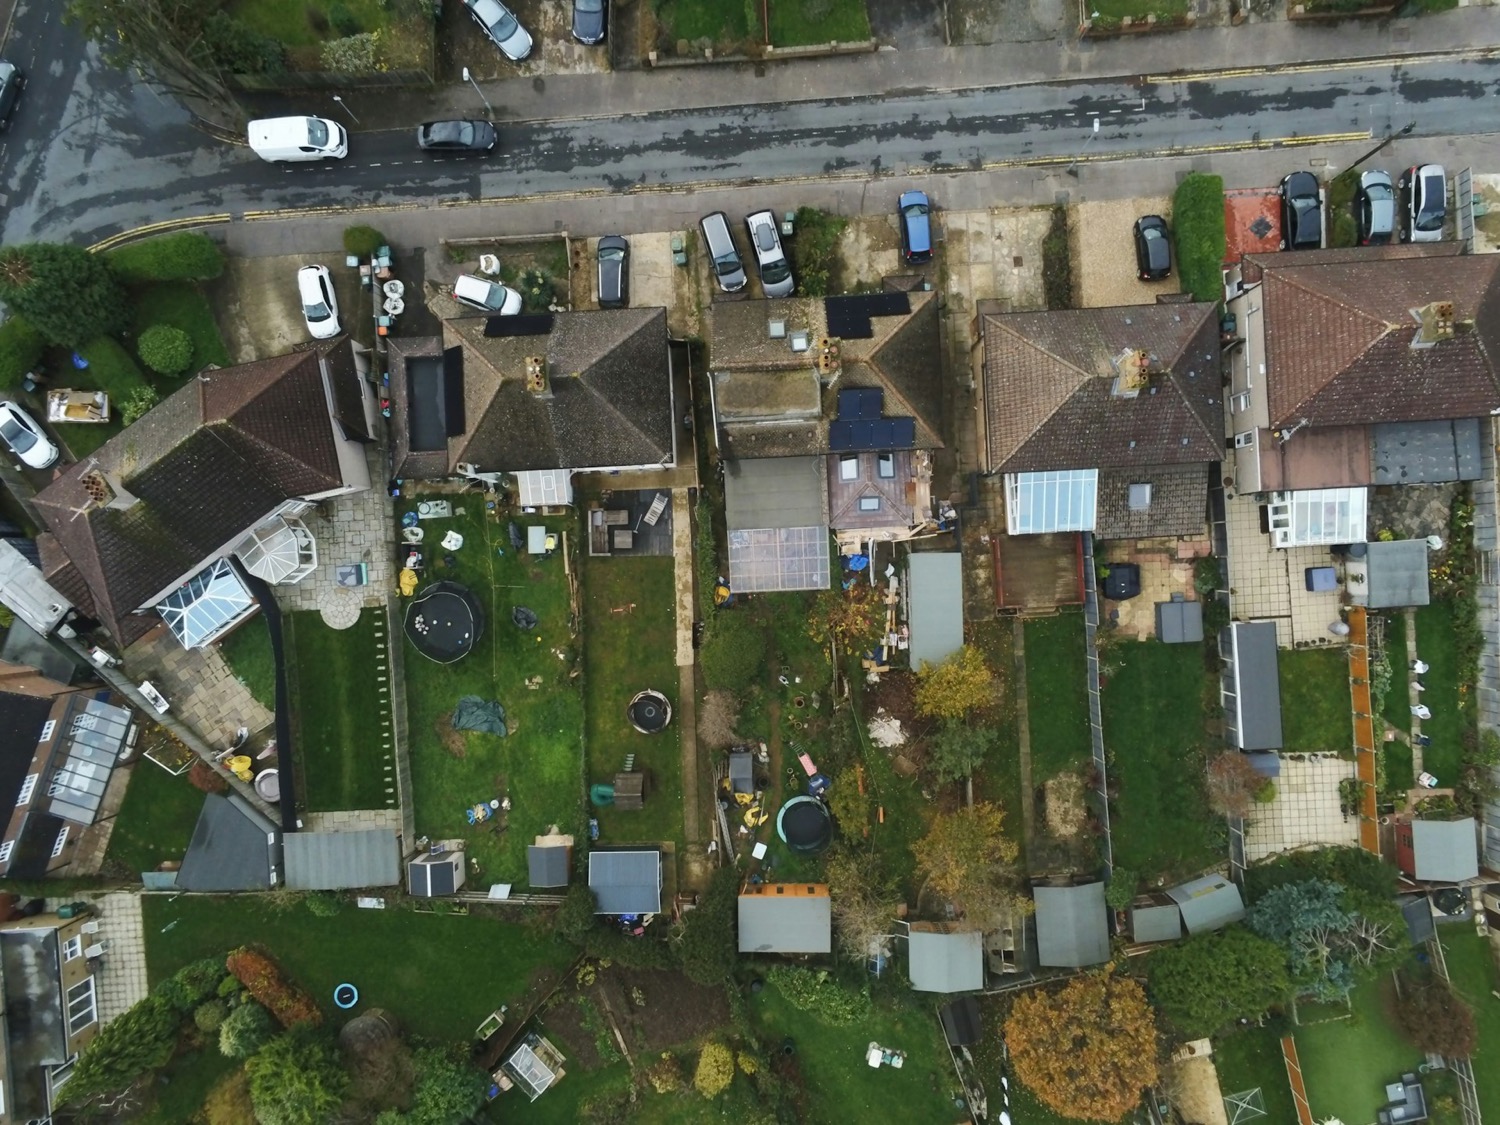
A Mask R-CNN model trained to detect and outline specific types of residential additions in 12.5 cm aerial imagery for an insurance client, reaching an object-level F1 of 0.85.
Employer: Sparkgeo (client project)
When: 2025
Data: 12.5 cm aerial imagery, Overture Maps building footprints
Methods: Deep learning object detection and instance segmentation (Mask R-CNN), transfer learning, data augmentation, spatial filtering of predictions
Stack: Python, PyTorch, Torchvision, Xarray, Rasterio, GeoPandas, QGIS
Background
An insurance client wanted to detect specific types of additions to homes. They first proposed satellite imagery, but the finest satellite imagery that was available and affordable, at around 50 cm, was too coarse for the task, so we recommended aerial imagery (12.5 cm pixel size) instead. The client needed to count individual additions and outline them accurately, so we used object detection with instance segmentation.
My contribution
- Met with the client to define their requirements.
- Evaluated satellite imagery for the task and found its resolution inadequate. Presented the result to the client and recommended aerial imagery as an alternative.
- Found a suitable source of aerial imagery, defined two areas of interest (AOIs), and priced the data acquisition.
- Developed and documented the method for creating training labels, carried out by a team of five annotators, including me.
- Each label carried a confidence field (high, medium or low), so annotators could self-assess its quality. After reviewing a sample at each level, I left the low-confidence labels (a few hundred) out of training.
- Shared the labelling workflow and a template GeoJSON file with the annotators, for consistency between them.
- Built the training dataset from a few thousand labels, with data augmentation (random flips, rotation, translation, cropping, brightness, contrast and saturation adjustments).
- Fine-tuned a Mask R-CNN model from pretrained weights on 80% of the labels, holding back 10% as a validation set during training and 10% as a test set for the final evaluation.
- Used Overture Maps building footprints to filter out false positives: a predicted addition was kept only if it touched or lay within a set distance of a building footprint.
- Tested transferability by developing the model on one AOI and keeping all labels from the second AOI for evaluation only.
- Developed an inference pipeline for large regions: it tiles multi-gigabyte images into overlapping 256 × 256 chips. The overlap ensured additions weren’t cut in half at tile edges, with duplicate prediction masks being merged before final output.
- Delivered the code and documentation to the client, and walked them through the accuracy assessment.
Outcome
- The model reached an object-level F1 score of about 0.85 on the test set from the training AOI, and about 0.7 on the held-out second AOI: it transfers to a new area, with some loss of accuracy.
- F1 was measured at an intersection over union (IoU) of 0.5, meaning a predicted outline had to overlap a labelled one by at least half their combined area.
- The building footprint filter reduced false positives and improved precision (F1 scores listed above were with the filter applied).
- Limitation: some targets were highly reflective and saturated the sensor, which washed out their texture. They were harder to label accurately, and an audit of the predictions showed the model struggled with them too.
Cover image: Aerial image of a residential neighbourhood. Photo by John Mosquera on Unsplash.