Property natural hazard risk
The data science behind the first version of a property risk platform: wildfire, earthquake, heat, hurricane and flood risk for US properties, built from FEMA National Risk Index components and higher-resolution hazard data.
Employer: Sparkgeo (client project)
When: 2023–2025 (intermittently)
Data: FEMA National Risk Index (NRI) and flood hazard layers, USGS 3DEP elevation and earthquake catalogue, wildfire perimeters (MTBS, NIFC), NOAA hurricane tracks and storm surge maps, weather APIs
Methods: Hazard scoring from NRI annualized frequency and historic loss ratio, multi-source data fusion, composite flood scoring, dataset evaluation
Stack: Python, GeoPandas, Rasterio, Xarray, Folium, Plotly, Jupyter, Quarto
Background
Our client, a property risk analytics company, helps insurers, reinsurers and property investors assess natural hazard risk to properties in the United States. Sparkgeo helped build the first version of its platform. Most of the team worked on the platform’s backend and frontend, while I focused on the data science, which was starting from almost nothing.
Approach
- Hazards: the first version covered the hazards most relevant to property damage: wildfire, earthquake, severe heat, hurricane, and coastal and inland flooding. The two flood types were combined into one flood score.
- Backbone: FEMA’s National Risk Index estimates risk for 18 natural hazards. Its headline risk score multiplies expected annual loss, which depends on the total value of buildings, people and agriculture in an area, by a community risk factor built from social vulnerability and community resilience. That suits FEMA’s purpose, disaster planning, but not the risk to an individual property. We used two of the underlying components instead: the annualized frequency of each hazard and its historic loss ratio, the share of exposed value typically lost when it occurs.
- Higher-resolution data: NRI values are aggregated to US Census tracts, which can miss hyper-local risks such as flooding at a particular address. We used a custom-computed version of the NRI layers and supplemented them with property-level data such as flood hazard zones and lidar-derived elevation, though those layers often had only partial coverage.
My contribution
- Data sourcing: evaluated many candidate datasets and sourced the ones the platform used, including the FEMA NRI and flood hazard zones, lidar-derived elevation, historical wildfire perimeters, hurricane tracks, storm surge hazard maps, historical earthquakes (location, date and magnitude) and real-time and historical weather from three APIs. I documented them for the client’s stakeholders.
- Prototype analytics: built the core hazard risk analytics, visualizations and reports. They were delivered as Jupyter notebooks with interactive plots and maps, interactive HTML reports, and matching static PDFs.
- Supporting the implementation: guided the development team as they built my analytics into the platform. I demoed the prototypes, documented the methods, and compared the platform’s outputs against my own.
Outcome
- The platform was built and generates custom property risk reports for the client’s customers. Each report gives an overall risk score, a score for each hazard, interactive plots, and text explaining the property’s risk and how the scores were calculated.
- The prototype property risk reports supported the client’s marketing.
- Limitations: most of the risk still rested on Census-tract data, and the higher-resolution layers that could sharpen it weren’t available everywhere. The longer-term goal was to build every risk score from property-specific data; that wasn’t done while I was on the project.
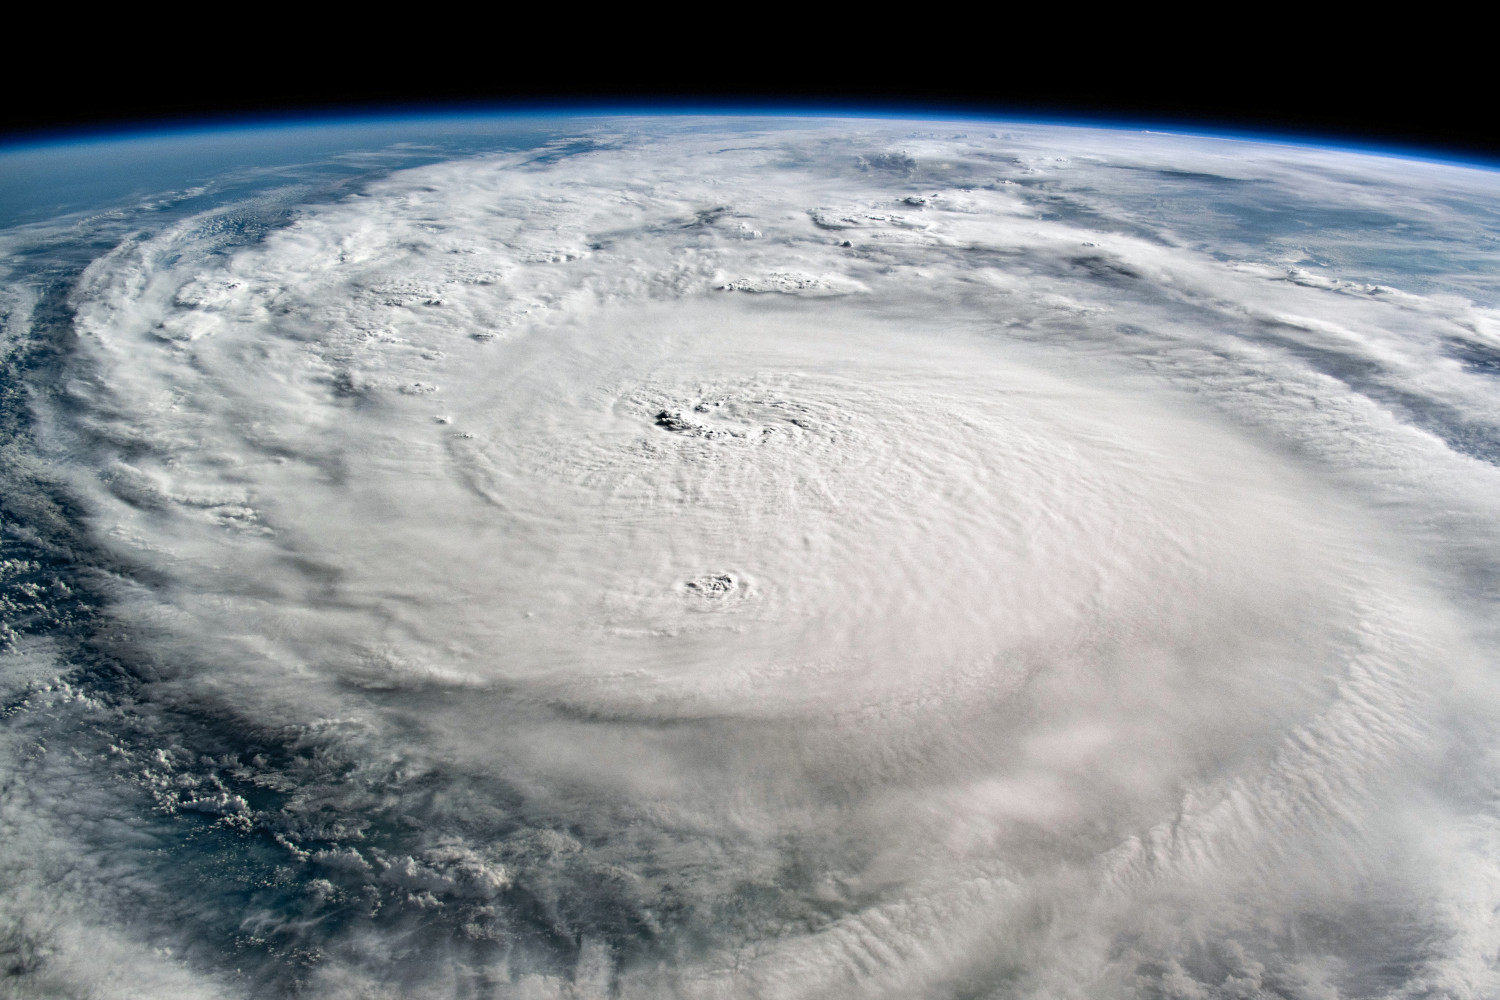
Cover image: Hurricane Milton over the Gulf of Mexico. Captured from on board the International Space Station (ISS) on October 8, 2024. Image source.