Lake and reservoir water levels from SWOT
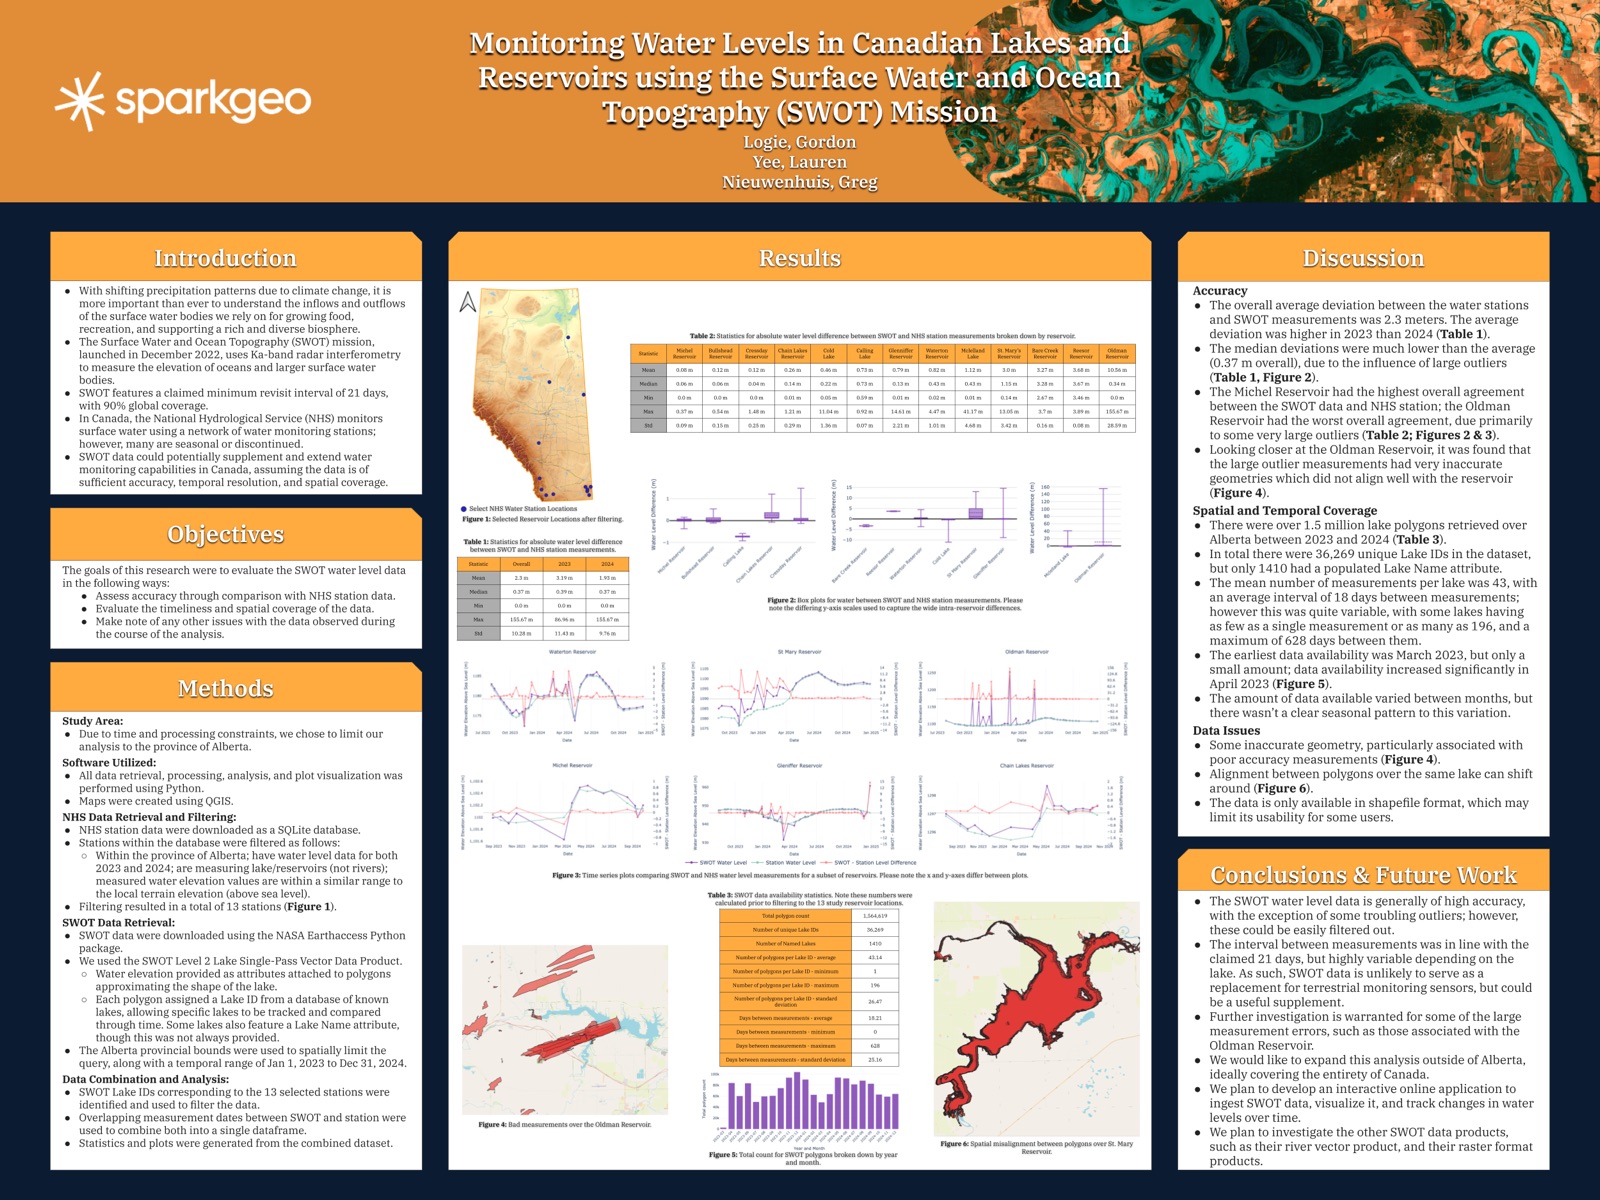
An internal study testing SWOT satellite water levels against 13 lake and reservoir gauges in Alberta: a median difference of 0.37 m, but with large outliers and irregular revisits. Poster at CSRS 2025.
Employer: Sparkgeo (internal project)
When: 2025
Data: SWOT Level 2 Lake Single-Pass Vector Data Product (2023–2024), National Hydrological Service (NHS) water monitoring station data
Methods: Station filtering, matching SWOT lake IDs to stations, date-matched comparison, error statistics, revisit and coverage analysis
Stack: Python, NASA earthaccess, QGIS
Background
The Surface Water and Ocean Topography (SWOT) mission, launched in December 2022, uses Ka-band radar interferometry to measure the elevation of oceans and larger surface water bodies. It claims a minimum revisit interval of 21 days, with 90% global coverage. In Canada, the National Hydrological Service monitors surface water with a network of stations, but many are seasonal or discontinued. SWOT could supplement them, if its data is accurate, frequent and widespread enough. This internal study tested that over lakes and reservoirs in Alberta, chosen to keep processing manageable.
My contribution
I designed and carried out the whole study; my co-authors on the poster reviewed the work.
- Station data: filtered the NHS station database to stations in Alberta that measure lakes or reservoirs (not rivers), have water levels for both 2023 and 2024, and report elevations close to the local terrain elevation, so they are referenced to sea level. That left 13 stations.
- SWOT data: downloaded the Level 2 lake product for Alberta, January 2023 to December 2024, with the NASA earthaccess Python package. Each record is a polygon outlining a lake, with water elevation as an attribute and a lake ID that lets a lake be tracked through time.
- Comparison: matched each station to its SWOT lake ID, joined SWOT and station measurements on overlapping dates, and computed difference statistics and time series plots for each reservoir.
- Coverage: measured how many lakes SWOT observed, how often, and how data volumes changed month to month, over the full Alberta dataset before filtering.
Outcome
- Accuracy: the median absolute difference between SWOT and the stations was 0.37 m, but the mean was 2.3 m because of large outliers (up to 155.67 m). The mean difference was higher in 2023 (3.19 m) than in 2024 (1.93 m).
- By reservoir: 9 of the 13 reservoirs had a median difference under 0.5 m, and Michel Reservoir agreed best (mean 0.08 m). Oldman Reservoir agreed worst (mean 10.56 m, median 0.34 m). Its outliers came with polygons that didn’t line up with the reservoir. Bare Creek and Reesor reservoirs differed by a steady 3.3–3.7 m with very little spread, which suggests a datum or reference offset between SWOT and those stations rather than measurement error. This wasn’t tested.
- Coverage: over 1.5 million lake polygons covered 36,269 lake IDs in Alberta, though only 1,410 lakes were named. Lakes averaged 43 measurements, 18 days apart, close to the claimed 21-day revisit. Coverage was very uneven, though: some lakes had a single measurement, and the longest gap was 628 days. Data started in March 2023 and ramped up in April 2023, with no clear seasonal pattern after that.
- Data issues: inaccurate geometries tied to the worst measurements, polygons for the same lake shifting between passes, and delivery only as shapefiles, which may limit who can use the data.
- Conclusion: the median difference is small (0.37 m), and most of the error comes from outliers that could be filtered. Revisits are too irregular for SWOT to replace ground stations, but it could usefully supplement them.
- Limitations: the study covered only Alberta and 13 stations, and the causes of the largest errors weren’t investigated further. The poster proposed extending the analysis across Canada, building an interactive application to track lake levels from SWOT, and evaluating SWOT’s river vector and raster products, but none of these were pursued.