Linking wildfires and flood damage
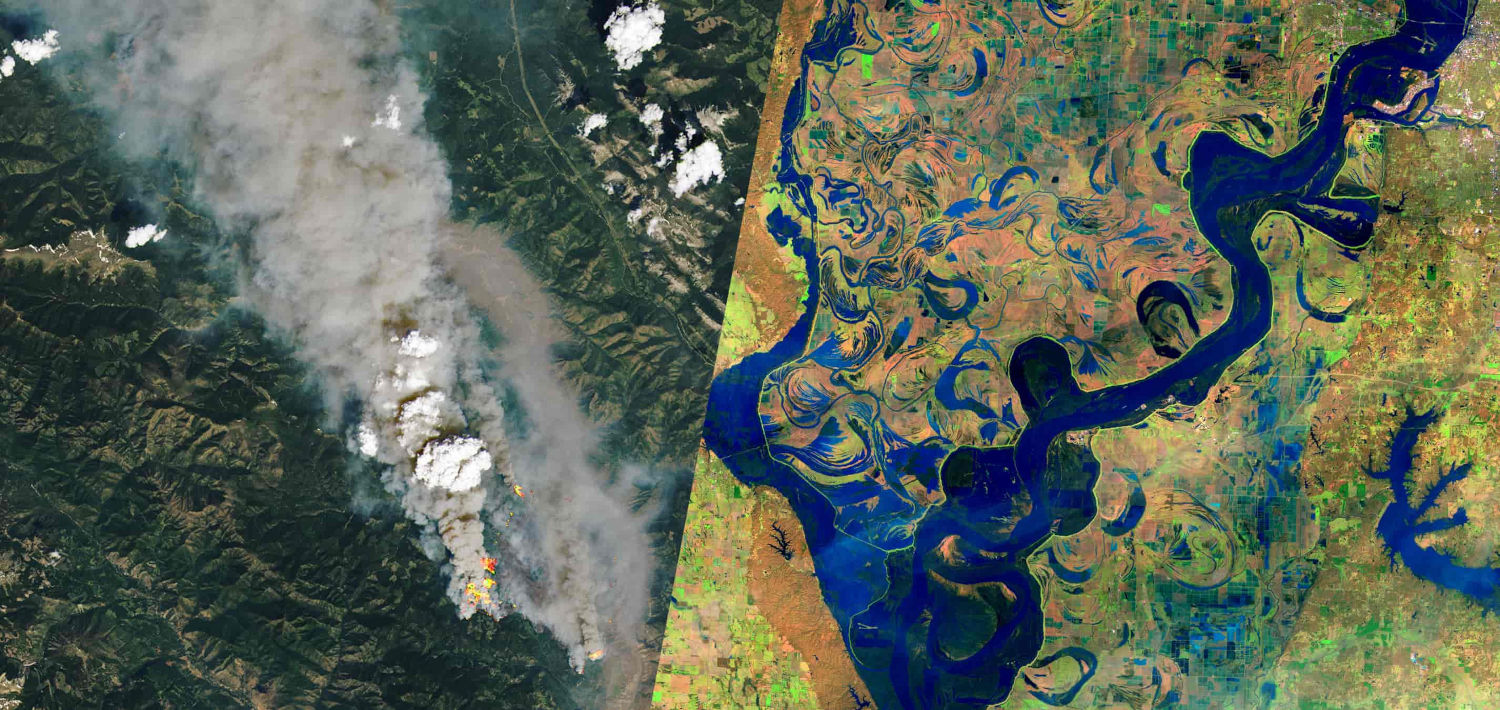
An automated workflow mapping 2021 BC wildfire burn severity from Sentinel-2, set against flood-damaged highways. Published as an interactive story map, presented at FOSS4G and CSRS 2022, and covered in the media.
Employer: Sparkgeo (internal project)
When: 2022
Data: Sentinel-2, NASA FIRMS (Fire Information for Resource Management System), GPM (Global Precipitation Measurement Mission), BC Ministry of Transportation and Infrastructure road damage photos, Google Street View, BC river basin outlines and river line polygons
Methods: Differenced Normalized Burn Ratio (dNBR) burn severity mapping
Stack: Python, Xarray, Rasterio, GeoPandas, STAC, Mapbox, JavaScript, Cloud Optimized GeoTIFF (COG)
Background
In 2021 southern British Columbia experienced a series of devastating wildfires, followed rapidly by severe flooding which caused widespread damage, particularly to major roadways. In the aftermath of these disasters, we wanted to investigate if the two were linked, with the wildfires producing conditions that exacerbated the flood damage. Severe fires can leave a water-repellent crust on the soil that lasts for years, increasing runoff and erosion during heavy rain.
My contribution
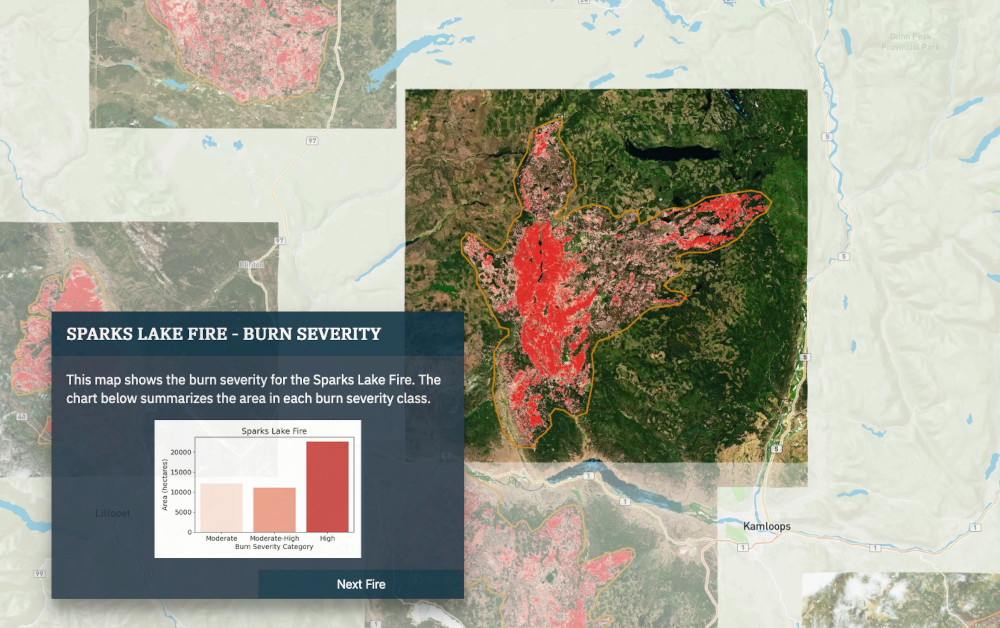
- Built a workflow that maps wildfire burn severity automatically: coarse resolution but frequent NASA FIRMS hotspots give each fire’s rough extent and start and end dates, which set the search area and dates for granular before/after change analysis using Sentinel-2.
- Mapped 36 road damage locations across seven highways from BC Ministry of Transportation and Infrastructure photos. Where photos had no location data, I placed them using the descriptions, satellite imagery and Google Street View.
- Used GPM precipitation data to find the areas of heaviest rainfall from the atmospheric river.
- Analyzed the links between severe fires and flood risk qualitatively.
- Created an interactive story map with Mapbox and custom JavaScript functions.
- Wrote, edited and published a blog post explaining the work.
Outcome
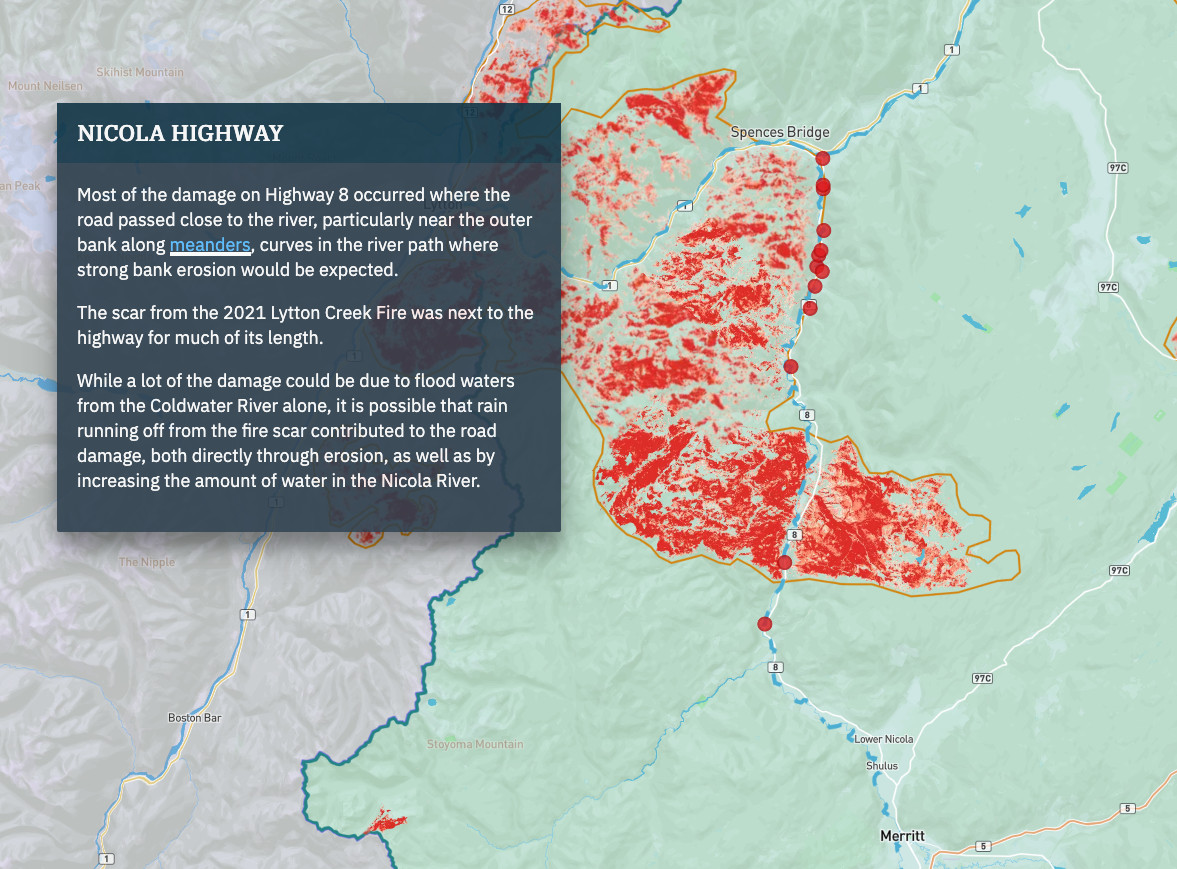
- Several recent, severe burn scars lay close to the subsequent road damage, a correlation consistent with the known effect of fire on runoff and erosion.
- Limitation: the analysis is qualitative. It doesn’t prove or measure how much the fires added to the damage; that would need slope, soil type, distance to rivers and land cover change as well.
- Findings published as a blog post and as an interactive story map.
- Presented at FOSS4G 2022 in Florence, Italy, and at the Canadian Symposium on Remote Sensing (CSRS) 2022.
- Covered by Global News (video), FlowingData and North Shore News, all in April 2022.