Prairie crop mapping with geospatial foundation model embeddings
Do frozen geospatial foundation model embeddings (AlphaEarth, TESSERA, OlmoEarth) beat a well-tuned Sentinel-2 baseline for Prairie crop mapping, with few labels, across years and provinces, and partway through the season?
Employer: Personal project
When: 2026 (in progress)
Data: Sentinel-2 L2A, AAFC Annual Crop Inventory (ACI), AlphaEarth, TESSERA and OlmoEarth embeddings
Methods: Frozen foundation model embeddings, linear probes, k-nearest neighbours, LightGBM, spatially blocked cross-validation
Stack: Python, STAC, LightGBM, Parquet, Zarr, Cloud Optimized GeoTIFF (COG)
Background
Geospatial foundation models now publish ready-made embeddings for the whole planet, and they are often claimed to replace hand-built satellite features. Crop type mapping is a good test: it is a well-studied problem, the Canadian Prairies have an open, annual crop label layer, and a carefully built Sentinel-2 baseline is a strong competitor.
This project asks where the embeddings actually help. The value is in the evaluation rather than a single benchmark score, and results where the baseline ties or wins are reported as findings.
Questions
- Label efficiency: how does performance scale with the number of labels per class?
- Generalization: does performance hold from one year to the next, and from Alberta to Saskatchewan?
- In-season: what is lost by stopping the season early, at the end of June, July or August?
- Leakage: how much do random train/test splits inflate scores, compared with spatially blocked splits?
A hypothesis for each question was written down before any experiments ran, and is not edited afterwards.
Approach
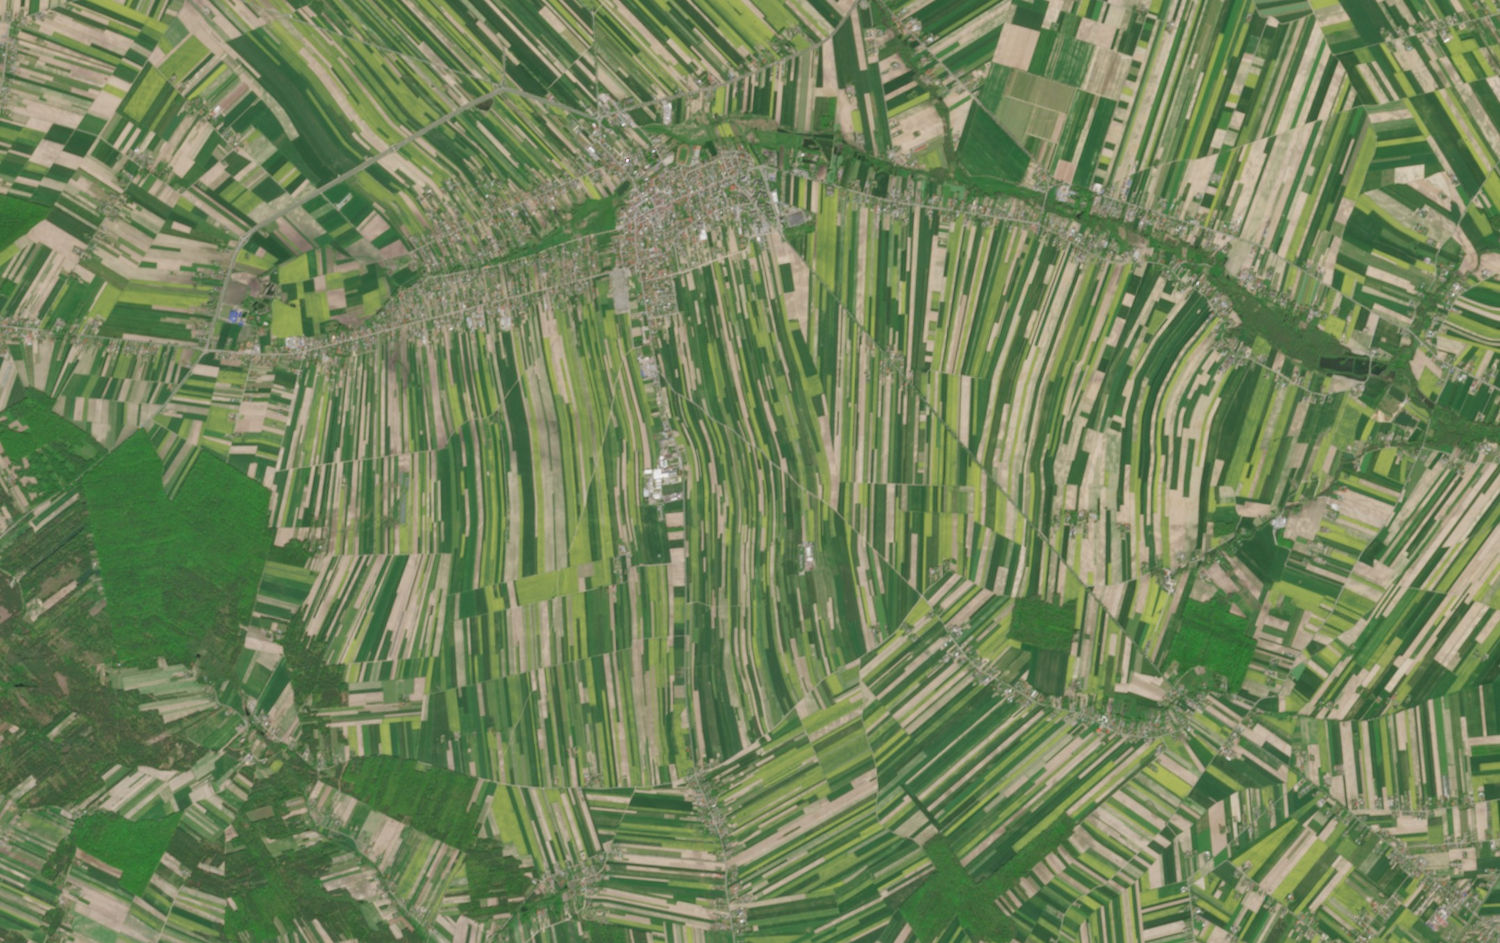
Study area and labels. The main study area is in southern Alberta around Lethbridge County, spanning irrigated and dryland farming, with Saskatchewan blocks held out for transfer: one with a similar crop mix and one deliberately mismatched as a hard case. Sites are chosen from the data before any model runs, by comparing township crop mixes from the ACI. Labels come from the ACI at 30 m, sampled from field interiors, at a fine level (e.g. spring wheat, durum, canola, lentils) and a coarse level (cereals, oilseeds, pulses, forage, specialty crops). The final townships and study years are still to be chosen.
Feature sets. A tuned Sentinel-2 baseline of monthly or biweekly composites, compared against frozen embeddings from AlphaEarth (64 dimensions, annual), TESSERA (128 dimensions, annual) and OlmoEarth (configurable from 1 to 12 months, which makes the in-season test possible).
Evaluation. Every feature set runs on the same spatial folds with the same classifier heads (logistic regression, k-nearest neighbours, LightGBM), so differences reflect the features rather than the setup:
- Folds are grouped by Alberta Township System township (about 9.7 km squares), so no block is in both training and test data.
- The baseline gets the same tuning budget as the embeddings, using nested block-grouped cross-validation, so an under-tuned baseline doesn’t flatter the foundation models.
- The headline metric is macro-F1, so rare crops count as much as common ones, with 95% intervals from bootstrap resampling over spatial blocks.
- Learning curves run from 10 to 1,000 labels per class, and all available, over several random draws.
Limitations. The ACI is itself a model product, noisiest at field edges and among cereals, so scores measure agreement with the ACI rather than ground truth. AAFC’s published per-class accuracies are reported as an approximate ceiling.
Status
The project is at an early stage. The plan runs from a feasibility check of data coverage, through the core benchmark (label efficiency and leakage), to the transfer and in-season tests. Results will be published as a blog post with result maps, and the code as a reproducible GitHub repository.